
Most articles about tool sprawl are written by companies that sell software for managing tool sprawl. Their numbers come from enterprises with hundreds of apps and an IT department, and their advice ends with “buy our dashboard.” If you run a 12-person agency, almost none of it fits.
So here’s the version for agencies. Real list prices for the stacks agencies actually run, at three sizes. The research that’s worth quoting, and the popular stats that don’t hold up. And a 90-minute audit you can do with a spreadsheet and last month’s card statement.
The main thing I’d want you to take away: the subscription bill is the smaller problem. A 20-person agency’s operations stack runs around $28,000 a year, and cancelling unused seats and duplicate tools will usually trim a slice of that. The bigger cost is the work your team does moving data from one tool to the next: retyping a client’s budget into the project tool, exporting hours to build an invoice, rebuilding a profitability report every quarter because no single tool knows both what a job cost and what it earned. That cost never shows up as a line item, so most audits miss it.
So don’t just ask “which tools can I cancel?” Ask “where does my data get copied by hand?” That’s a different list, and it’s the one that matters.
What the research actually says about tool sprawl
There’s a lot of data on this. Here’s what’s solid, and what it does and doesn’t tell you.
Spend per employee is real money, but it’s enterprise money. Zylo’s 2026 SaaS Management Index puts median SaaS spend at $9,455 per employee. Vertice’s data lands in the same place, at roughly $9,100 per employee at the end of 2025. Before that number scares you, know that the companies in Zylo’s data spend an average of $55.7 million a year on software. Budgets that size cover ERPs, security suites, and data platforms that agencies don’t buy. As you’ll see below, a typical agency operations stack costs closer to $1,000 to $1,500 per person per year.
Paid seats sit unused. Zylo reports companies leave 46% of licenses unused on average. (They also publish 36%, measured against a different utilization threshold. Blogs mix the two up.) A small agency will waste less, but the pattern holds: seats get added for a project, a contractor, or a new hire, and rarely get removed.
The waste isn’t only seats. In a Freshworks survey from November 2025, workers said $1 of every $5 spent on software is wasted, that they juggle 15 different tools on average, and that they lose nearly seven hours a week to complicated processes and fragmented tools. It’s self-reported, so treat it as a ceiling. Even half of that is a lot.
Switching between apps has a measured cost. The best study here appeared in Harvard Business Review in 2022. It tracked 137 people at three Fortune 500 companies for up to five weeks. They switched between apps and websites nearly 1,200 times a day, and spent just under four hours a week getting their bearings again afterward. That’s about 9% of the workweek. The participants were mostly back-office staff, not creative teams, and the authors sell work-analytics software. Still, it’s measured behavior, not a survey, which is rare.
Finding things is the bigger tax. Atlassian’s State of Teams 2025 found teams spend 25% of their time just searching for answers. Gartner found 47% of digital workers struggle to find the information they need to do their jobs.
Prices are rising faster than your rates. Vertice measured SaaS inflation at 16.4% in June 2026, the highest it has recorded. Gartner says enterprise SaaS costs often rise 10% to 20% or more at renewal. And Zylo found 79% of IT leaders hit a price increase at renewal in the past year. If your stack costs $28,000 today and you do nothing, plan on noticeably more next year for the same tools.
Here’s what doesn’t exist: a reliable, public number for how much agencies spend on software. You’ll see “agencies spend 3.7% of revenue on tools” around the web. I tried to trace it and couldn’t find a source. The closest real benchmark I know is Parakeeto’s agency financial model. It doesn’t break out software, but it puts administration at 8% to 12% of agency gross income and shared delivery costs (things like Adobe and Figma) at 3% to 6%. Software lives inside those two buckets, so it should be a modest slice of a range that’s somewhere around 11% to 18% combined. If software alone is creeping toward the top of that range, look closer.
Four tool sprawl stats you should stop quoting
These come up in almost every article on this topic, and they’re shakier than they look.
”It takes 23 minutes to refocus after an interruption”
This one gets attributed to Gloria Mark at UC Irvine. In the actual research, the 2005 paper reports about 25 minutes, and it measures the time until people returned to the interrupted task, after working on about two other things in between. It’s not the time it takes to get back into focus. The 23-minute version comes from a 2006 interview. It’s an interesting finding. It just isn’t “every Slack ping costs 23 minutes."
"Your attention span is 47 seconds”
Also Gloria Mark, and also usually misread. It’s the average time people spend on one screen before switching to another. That’s a description of behavior, not a limit on what your brain can do.
”Workers are interrupted 275 times a day”
From Microsoft’s 2025 Work Trend Index. Microsoft’s own fine print says this describes the top 20% of users by message volume, counted across a full 24-hour day. It’s not the average worker.
”Context switching wastes 40% of your productivity”
This traces back to a psychologist’s estimate based on lab experiments with complex tasks. It was offered as a rough upper limit, not something measured in offices. People repeat it as if it were measured.
If you’re making the case to your partners for cleaning up the stack, a stat that falls apart under questioning hurts you. The HBR study and your own audit numbers are much stronger evidence.
What a typical agency stack costs, at three sizes
These are list prices from each vendor’s pricing page as of October 2026, per month, using annual billing where it’s offered (FreshBooks and QuickBooks are shown at their monthly price). I picked the plan an agency that size would realistically be on. Your exact tools will differ, but the shape usually matches.
I left out production tools (Adobe, Figma, dev tooling). Those are what your team uses to make the actual work, and you’re not going to consolidate them.
Solo or freelancer: about $78 a month
| Job | Typical tool | Plan | Monthly |
|---|---|---|---|
| Projects and notes | Notion | Plus | $10 |
| Time tracking | Toggl Track | Starter | $9 |
| Invoicing | FreshBooks | Lite | $23 |
| Scheduling | Calendly | Standard | $10 |
| Email, files, video calls | Google Workspace | Business Starter | $7 |
| Proposals and e-sign | PandaDoc | Starter | $19 |
| Total | $78 |
That’s about $936 a year. Honestly, for a solo business that’s not where the problem is. The real cost is the hour or two a month spent rebuilding invoices from the time tracker and copying client details from the proposal tool. Six tools for one person is a lot of logging in.
Small studio, 5 people: about $433 a month
| Job | Typical tool | Seats | Monthly |
|---|---|---|---|
| Project management | Asana Starter | 5 × $10.99 | $55 |
| Time tracking | Harvest Teams | 5 × $9 | $45 |
| Accounting and invoicing | QuickBooks Essentials | flat | $85 |
| Team chat | Slack Pro | 5 × $7.25 | $36 |
| Email and files | Google Workspace Standard | 5 × $14 | $70 |
| Docs and wiki | Notion Plus | 5 × $10 | $50 |
| Client video calls | Zoom Pro | 2 × $14.16 | $28 |
| Scheduling | Calendly Standard | 2 × $10 | $20 |
| Proposals and e-sign | PandaDoc Starter | 1 × $19 | $19 |
| Passwords | 1Password Teams | flat | $25 |
| Total | $433 |
About $5,200 a year, or around $1,040 per person. Ten tools for five people. Notice Zoom here: Google Workspace already includes Meet, so the agency is paying twice for video calls. That kind of overlap is common and easy to miss.
Agency, 20 people: about $2,343 a month
| Job | Typical tool | Seats | Monthly |
|---|---|---|---|
| Project management | monday.com Pro | 20 × $19 | $380 |
| Time tracking | Harvest Teams | 20 × $9 | $180 |
| Resource planning | Float Pro | 20 × $12 | $240 |
| Accounting and invoicing | QuickBooks Plus | flat | $140 |
| Team chat | Slack Pro | 20 × $7.25 | $145 |
| Email and files | Google Workspace Standard | 20 × $14 | $280 |
| Docs and wiki | Notion Plus | 20 × $10 | $200 |
| Client video calls | Zoom Pro | 6 × $14.16 | $85 |
| Scheduling | Calendly Teams | 6 × $16 | $96 |
| Proposals and e-sign | PandaDoc Business | 3 × $49 | $147 |
| CRM | HubSpot Sales Hub Professional | 3 × $90 | $270 |
| Passwords | 1Password Business | 20 × $8.99 | $180 |
| Total | $2,343 |
That’s about $28,100 a year, around $1,400 per person, plus a one-time $1,500 onboarding fee that HubSpot requires on its Professional tier. Twelve tools.
The number I’d pay most attention to here isn’t the total. It’s what one more hire costs before they do any work:
The seat tax on every new hire
Sum of every per-seat price that applies to everyone
What good looks like
In the 20-person stack above: $19 + $9 + $12 + $7.25 + $14 + $10 + $8.99 = about $80 a month, or roughly $960 a year per person, before they do any billable work.
Seven of these twelve tools charge per person. So headcount growth increases your software bill automatically, and nobody approves the increase because nobody sees it as a decision.
The cost that isn’t on the invoice
Look at the 20-person stack again. Client and budget details live in HubSpot and PandaDoc. Tasks and deadlines live in monday. Hours live in Harvest. Who’s booked next month lives in Float. Invoices and payments live in QuickBooks. Each tool does its own job fine. The trouble is in between them.
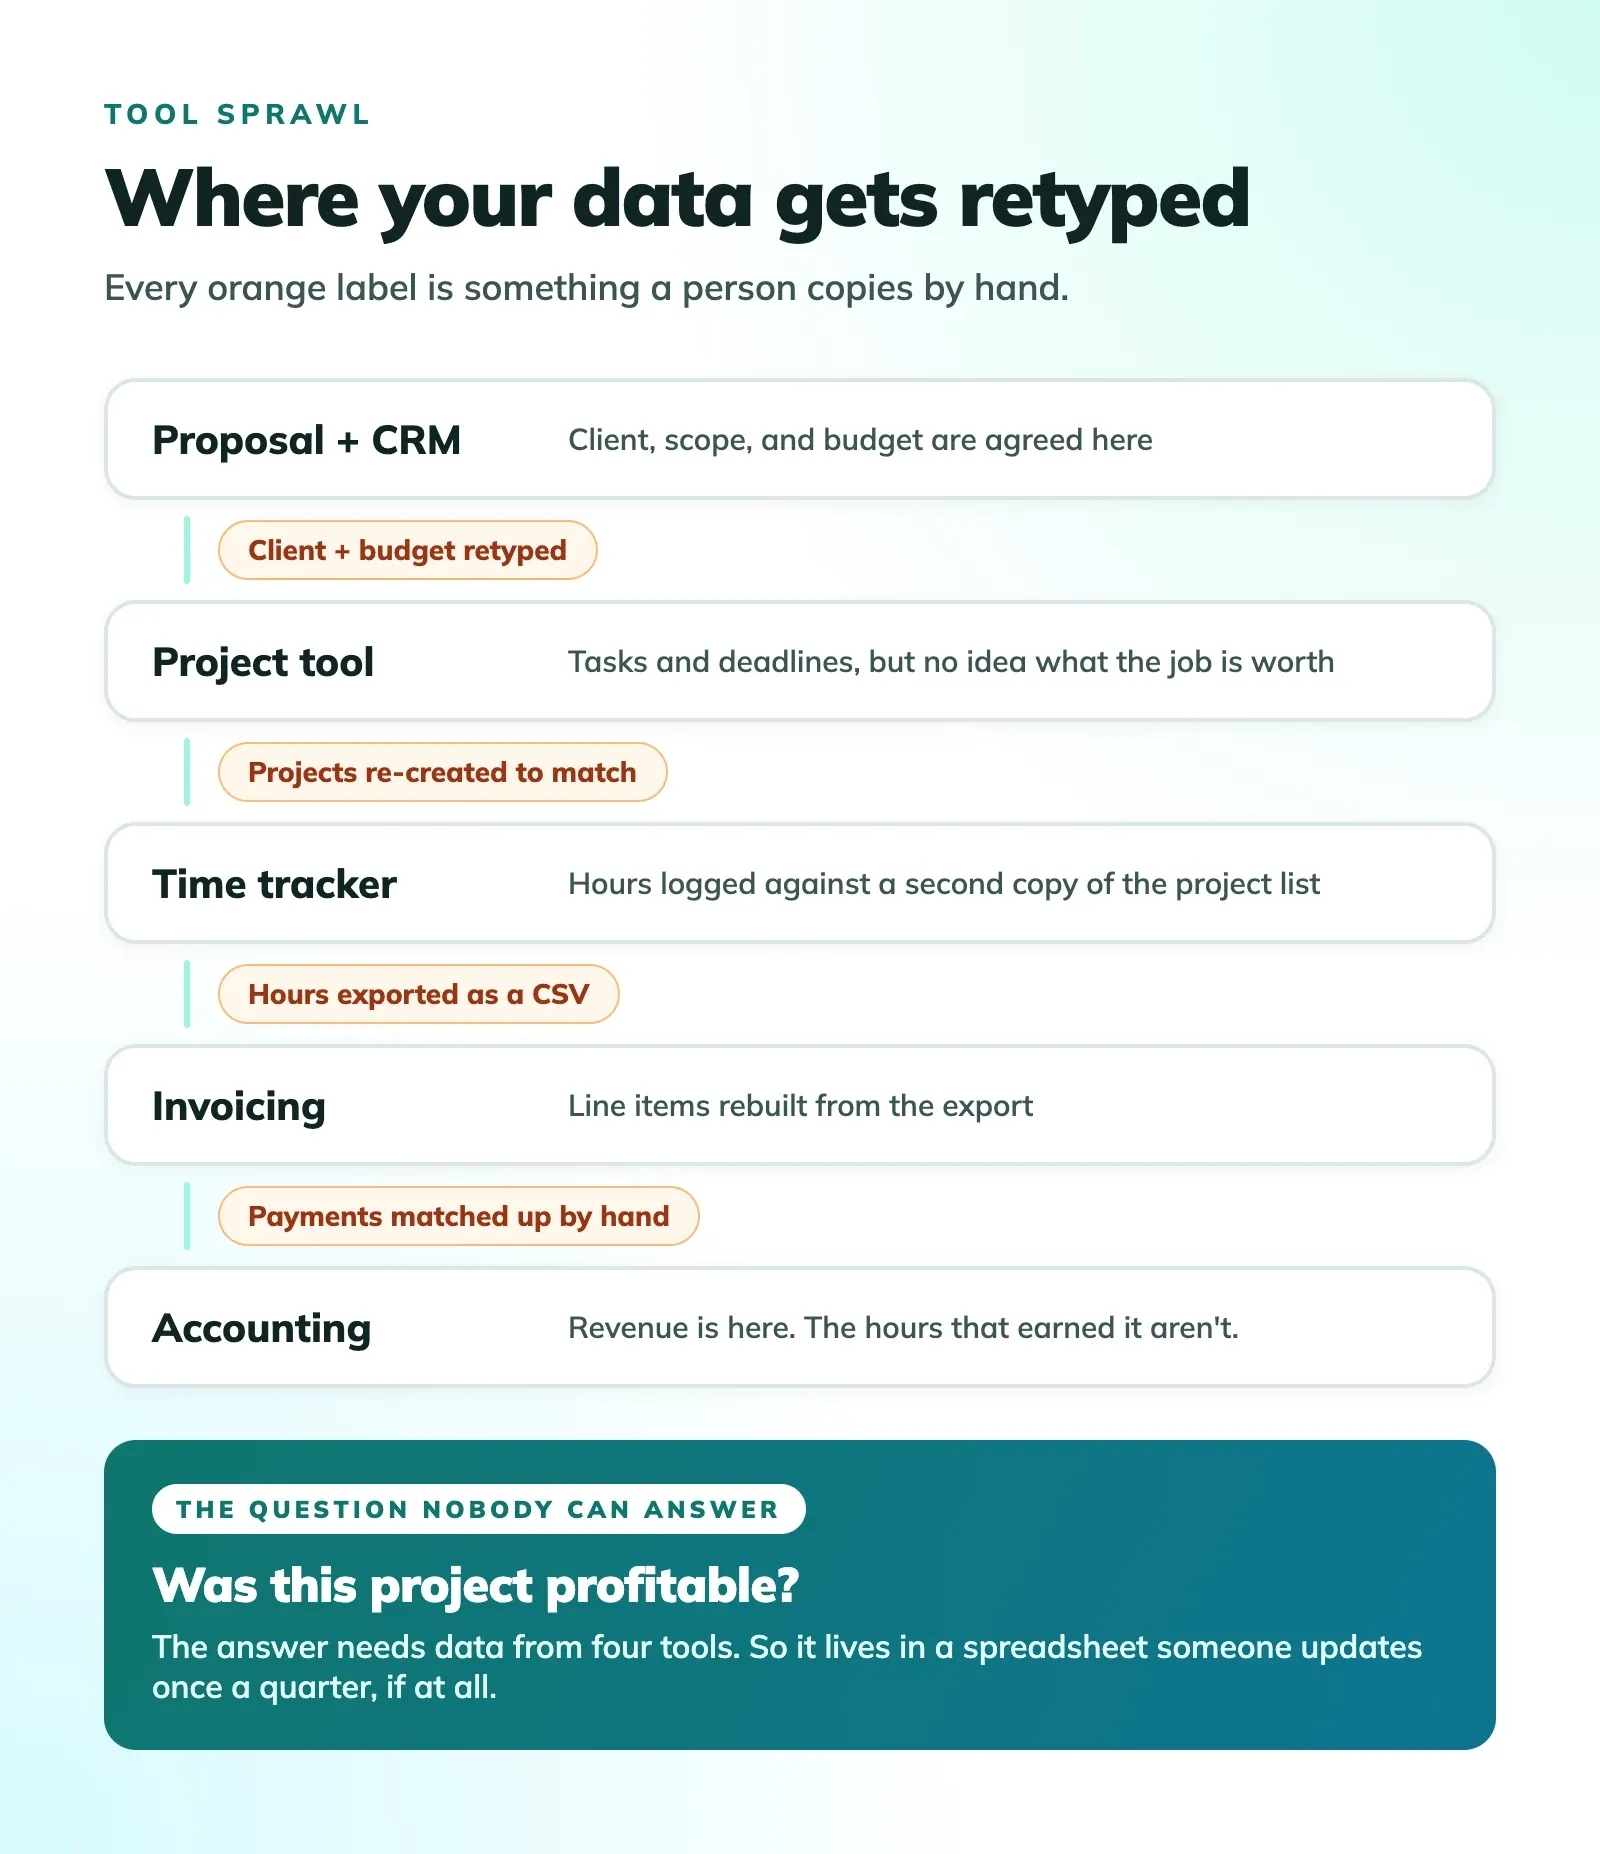
I call these the seams: every place where data has to be copied by hand to get from one tool to the next. In a typical project-based agency, there are four.
- Sale to project. The signed scope and budget get retyped into the project tool, usually without the budget, because PM tools don’t care about money.
- Project to time tracker. The project list gets rebuilt in the time tracker, then kept in sync by hand every time a project is added or renamed.
- Time to invoice. Hours get exported, cleaned up, and rebuilt as line items.
- Invoice to books. Payments get matched up, and the client’s payment history ends up in a tool nobody on the delivery side ever opens.
Every seam costs time each week and invites errors. But the biggest cost is the question none of your tools can answer by itself: was this project profitable? To answer it, you need the quoted price (from the proposal tool), the hours (from the time tracker), who worked them and at what cost (from payroll), and what you’ve actually been paid (from the books). So somebody builds a spreadsheet, it’s out of date the week after it’s built, and pricing decisions get made on gut feel. (I wrote about why effective hourly rate is the most useful number an agency can track. This is the main reason most agencies don’t track it.)
Integrations help, sometimes. A Zapier connection between your time tracker and invoicing tool closes one seam. But it’s another subscription, it breaks quietly when one side changes a field, and it belongs to whoever set it up, who may have left. An integration patches a seam. It doesn’t remove it.
The 90-minute tool audit
You need a spreadsheet, the company card statements, and your admin logins. Block out an hour and a half.
Step 1: Build the list from statements, not from memory (20 minutes)
Pull three months of statements from every company card and every expense report. Search for anything recurring. Don’t skip expense reports: Zylo found business units now control 81% of SaaS spend, and ChatGPT is now the most expensed app. In an agency, that’s the designer’s personal Midjourney plan and the strategist’s ChatGPT subscription, both quietly reimbursed every month.
It’s very common to find at least one tool nobody remembered paying for.
Step 2: Fill in these columns (30 minutes)
| Column | What goes in it |
|---|---|
| Tool | Name |
| Job | What it’s for, in a few words. Use the same words across tools, so duplicates line up |
| Owner | One person who’d notice if it disappeared |
| Monthly cost | Normalize annual plans to monthly |
| Seats paid / seats active | Active means logged in within 30 days. Most admin panels show this |
| Renewal date | Especially for annual plans |
| Data that lives here | Clients, tasks, hours, invoices, files, conversations |
| Where that data goes next | The seam column. “Hours exported to QuickBooks monthly by Dana” |
That last column is what makes this different from a normal software audit. It’s also the one that takes the most thought, so ask the people who actually move the data. The people running the agency often don’t know how many exports happen every month.
Step 3: Run three checks (20 minutes)
The seat check. Compare seats paid to seats active. Former employees, contractors who left, and people with seats in tools they never use. This is the quickest win, and you can usually make the changes the same day.
The overlap check. Sort by the Job column. Any job with two or more tools is an overlap. Common ones: video calls (Zoom on top of Meet or Teams), docs (Notion on top of Google Docs), and file storage (Dropbox on top of Google Drive). Zylo found the average company it tracks runs 11 project management tools. You won’t have eleven, but having two is common. It usually happens when one team started using a different tool and nobody stopped it.
The seam check. Count the entries in the last column. Then, for two weeks, have whoever does each handoff log how long it takes. Multiply by their cost per hour. That’s the price of your seams, and it’s usually bigger than you’d guess.
Step 4: Sort every tool into keep, merge, or cut (20 minutes)
- Cut: unused seats, duplicate tools, anything no one would notice for a month.
- Merge: tools on either side of a seam. These are the candidates for consolidation, and they’re usually in the project, time, invoicing, and client category.
- Keep: tools that do one job, don’t need to share data with anything else, and that your team actually likes.
Then add every renewal date to your calendar, 60 days early. Renewal is the only time you have leverage, and with prices rising at double-digit rates, it’s worth showing up prepared.
What to consolidate first (and what to leave alone)
Not every category is worth consolidating. Ranked by how much consolidation tends to pay off for an agency:
- Projects, time, and invoicing. Most of the seams are here, and so is the profitability question. If you only merge one area, make it this one.
- Client records, proposals, and e-signature. Where the job’s budget is first agreed. Merging this with projects means the budget is already there when the project starts.
- Resource planning. If your resourcing tool doesn’t know about your projects and time, you’re maintaining a third copy of the project list, plus everyone’s schedule.
- Chat, calls, and scheduling. Smaller savings and fewer seams, but you’ll get a lot of overlap here.
- Leave alone: accounting software (your accountant wants QuickBooks or Xero, and that’s fine), email and file storage (Google Workspace or Microsoft 365 handles it well), your password manager, and your production tools.
Tool consolidation advice I’d ignore
“Cut everything you don’t use daily.” Some tools are supposed to be used rarely. Your password manager, your accounting software, your e-sign tool. Usage frequency is a terrible way to decide what to keep. Whether a tool’s data needs to be somewhere else is a much better one.
“Switch everything to annual billing and save 20%.” Only for tools you’ve decided to keep for at least a year. Annual billing on a tool you’re about to replace locks you in.
“Best-of-breed always wins.” Best tool in each category plus integrations sounds great until you count the integrations. Each one is a seam with a subscription attached, and someone has to maintain it. For a team without a full-time ops person, a slightly less specialized tool that shares data with the rest of your work usually beats a perfect one that doesn’t.
“Do a big migration over a weekend.” Move one seam at a time, starting with a single new client, not your whole list.
Is an all-in-one actually cheaper?
This is the part where I have to say up front: I run an all-in-one platform for agencies, so read this section with that in mind. I’ll show the math and you can decide.
In the 20-person stack, the tools an agency all-in-one would typically replace are project management, time tracking, resource planning, chat, docs, client video calls, scheduling, and proposals and e-sign. That’s about $1,473 a month. The tools it shouldn’t replace (accounting, Google Workspace, the password manager, and the CRM if you have a dedicated sales team) stay as they are.
Three honest caveats:
- They don’t all cover the same things. Some agency all-in-one platforms cover projects, time, and invoicing but not chat or calls. Some include resource planning and some don’t. Compare each one against your seam list from the audit, not against its feature list.
- Check the limits on the replacements. Bundled video calls, e-signatures, and AI features usually come with caps (call length, participants, signatures per month). Make sure they’re enough for how your team actually works before you cancel the separate tool.
- The bigger win is the data, not the price. Even if the subscription total came out the same, having the budget, the hours, and the invoice in one place is what finally answers “was this project profitable?” without anyone building a spreadsheet. If you want to see what that question looks like with your own numbers first, the project profitability calculator works without an account.
If your audit shows few seams (say, a retainer business with simple monthly billing and no time tracking), an all-in-one may not be worth the switch. That’s a fine answer too.
Where to start
Do the 20-minute version this week: pull three months of card statements and expense reports, list every recurring software charge, and compare seats paid to seats active. That alone usually pays for the hour.
Then fill in the “where does this data go next” column for your three most-used tools. If it lists a handoff someone does by hand every week, that’s your most expensive seam, and it’s where consolidation is worth looking at first.
And if you want a single number to track over time, use software cost per person: your total monthly software spend divided by headcount. If it climbs faster than your average billing rate, your tools are taking more of your margin each year, and nobody decided that on purpose.

Brendan Shulman
Founder & CEO, FeatureFlight
Brendan Shulman is the founder and CEO of FeatureFlight and a software engineer with a passion for building useful, intuitive products. He writes about project management, productivity, software, and the lessons he’s learning while building and growing FeatureFlight.
Keep reading
- 15 Productivity Metrics Every Team Should Track (And the 5 That Actually Matter)
Fifteen productivity metrics for agencies and freelancers, with the formula for each one, what a healthy number looks like, and which five to start with.
- The Agency Client Onboarding Checklist: From Signed Contract to Day 14
A client onboarding checklist for agencies: 12 steps from signed contract to day 14, with the templates, the kickoff agenda, and the six you can't skip.